In short
An open south roof at 35° in Frodsham makes about 941 kWh a year per kWp; the best in our runs, south at 40°, makes 943. East and west roofs make about 79% and 80% of the best. Under the hill, a south roof loses a few per cent over the year and about a third in December.
Open-sky output, every direction and pitch
Each figure is a year’s output from 1 kWp in the centre of Frodsham (53.295° N, 2.725° W), from PVGIS 5.3 with 14% losses. For a 4 kWp south roof at 35°, multiply: about 3,764 kWh.
| Roof faces | 10° | 20° | 30° | 35° | 40° | 45° | 50° |
|---|---|---|---|---|---|---|---|
| South | 855 | 904 | 934 | 941 | 943 | 940 | 932 |
| South-east | 833 | 865 | 881 | 883 | 881 | 874 | 863 |
| South-west | 836 | 869 | 887 | 891 | 889 | 883 | 873 |
| East | 782 | 771 | 755 | 744 | 732 | 717 | 699 |
| West | 785 | 776 | 763 | 753 | 742 | 727 | 710 |
| North-east | 730 | 670 | 613 | 586 | 560 | 534 | 509 |
| North-west | 731 | 673 | 619 | 593 | 567 | 542 | 516 |
| North | 708 | 630 | 553 | 515 | 477 | 440 | 404 |
The same roof under the hill
| Roof faces | Under the hill | Clear sky | Difference |
|---|---|---|---|
| south | 908 | 942 | 3.6% |
| south-east | 842 | 885 | 4.9% |
| south-west | 879 | 891 | 1.3% |
| east | 715 | 746 | 4.1% |
| west | 753 | 753 | 0.0% |
The ridge rises most steeply to the south-east of the hill-foot point, so morning roofs lose most and a west-facing roof loses nothing. The hill and winter sun sets out how the figures were run, and east and west roofs what it means for choosing a slope.
Month by month
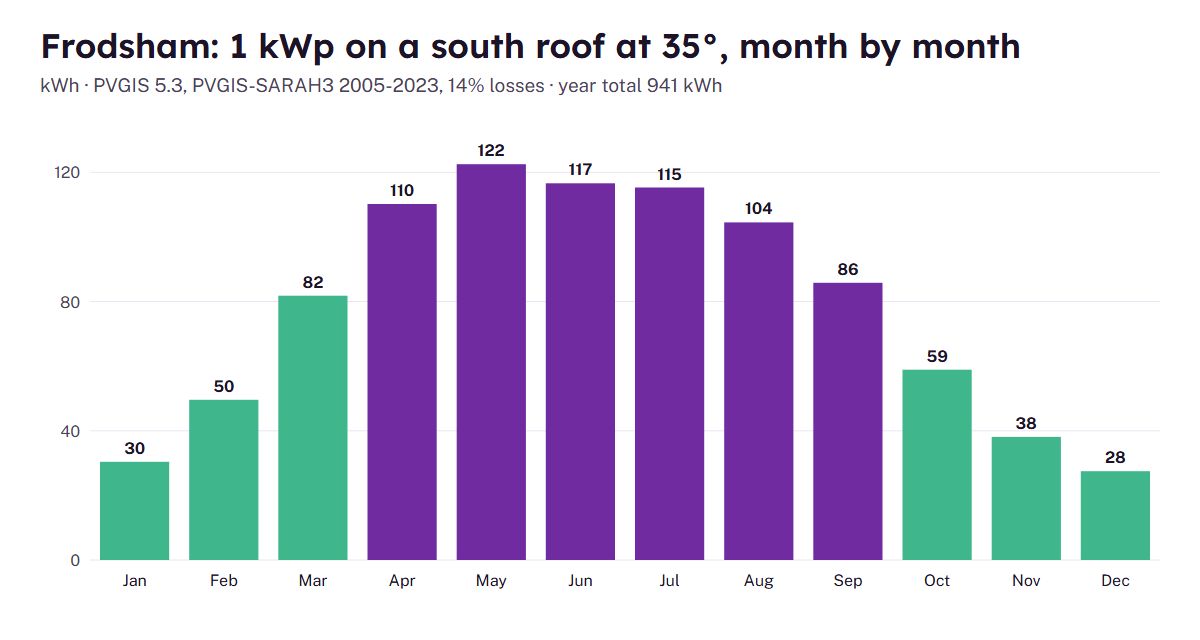
| Jan | Feb | Mar | Apr | May | Jun | Jul | Aug | Sep | Oct | Nov | Dec |
|---|---|---|---|---|---|---|---|---|---|---|---|
| 30 | 50 | 82 | 110 | 123 | 117 | 115 | 105 | 86 | 59 | 38 | 28 |
November to January together make 96 kWh per kWp on an open roof. That is the season the hill bites: at the hill-foot point December falls to 19.1 kWh from 28.3. Summer is untouched. Export and self-use looks at what that does to the value of the units.
System sizes, open sky and under the hill
| System | South, open sky | South, hill foot | West, either |
|---|---|---|---|
| 2 kWp | 1,882 | 1,816 | 1,506 |
| 3 kWp | 2,823 | 2,724 | 2,259 |
| 4 kWp | 3,764 | 3,632 | 3,012 |
| 5 kWp | 4,706 | 4,540 | 3,765 |
| 6 kWp | 5,647 | 5,448 | 4,518 |
The gap between the first two columns is the ridge at work. A west-facing roof keeps its afternoon sun wherever it is in town, which is why the third column needs no second version.
Inside the open-sky figure
For the open-sky point in the centre of Frodsham, PVGIS reckons a south slope at 35° receives about 1,164 kWh of sunlight per square metre each year, averaged over 2005-2023 (PVGIS 5.3). That would be the yield of a perfect 1 kWp array, since panels are rated in full sun of one kilowatt per square metre. The model then trims it: 3.2% where the sun strikes the glass at a slant and bounces off, 4.5% for cell heat and overcast light, plus 1.7% back for a favourable spectrum, and our standard 14% for cabling, the inverter and dirt. The total cut is 19.2%, giving 941 kWh.
The steadiest of the six towns
Frodsham’s sunshine varies less from year to year than in any of the other five Cheshire towns we ran. PVGIS puts the standard deviation at about 28 kWh per kWp, roughly 112 kWh either way on a 4 kWp roof. Under the hill, though, the ridge takes about 34 kWh per kWp off a south roof every year, which is more than that typical swing between a good year and a poor one. The hill is a bigger factor for those houses than the weather.
Where the open-sky table applies
Most of the town. Our Main Street point loses 0.4 kWh per kWp to the terrain, the Overton hilltop point 0.0 and the marsh-side point to the north 0.1, so for all three the first table is the right one. Only close under the ridge, south of the centre, does the second table take over. Month to month, the bright months swing most: May varies by about 15 kWh per kWp from one year to the next and December by about 5.
Pitch
On open sky the model’s best tilt for a south roof in Frodsham is 39°, at 943 kWh per kWp, barely 2 above 35°. Pitch is rarely worth worrying about here; position under the ridge, and trees, are.
When the table is not enough
Four kinds of Frodsham roof need more than a look-up. Under the wooded slopes, trees and shade explains what a site survey should record. On older Main Street houses, listed and thatched homes sets out the consents, and on a roof that faces east and west, east and west roofs shows how the two slopes add up. For everyone, the figures above are best read beside the price per kW on the cost page.
From table to quote
An MCS-certified firm has to give you a performance estimate for your own roof (MCS). Compare it with the right table above: open sky in most of the town, the hill table if the ridge fills your southern view. Exported units earn a tariff under the SEG. The hill-shade checker does the sums for four kinds of location, and costs covers the price side.